Belle II Software development
QuadTreePlotter Class Reference
Inheritance diagram for QuadTreePlotter:
SegmentQuadTreePlotter StereoQuadTreePlotter QueueStereoQuadTreePlotter

Public Member Functions

def __init__ (self, queue)
 
def plot_quad_tree_content (self)
 
def save_and_show_file (self)
 
def init_plotting (self)
 
def event (self)
 
def terminate (self)
 

Public Attributes

 file_name_of_quad_tree_content
 cached output filename
 
 draw_quad_tree_content
 cached flag to draw QuadTree
 
 range_x_min
 cached minimum x value
 
 range_x_max
 cached maximum x value
 
 range_y_min
 cached minimum y value
 
 range_y_max
 cached maximum y value
 
 queue
 cached value of the queue input parameter
 
 file_names
 cached array of output filenames (one file per image)
 

Detailed Description

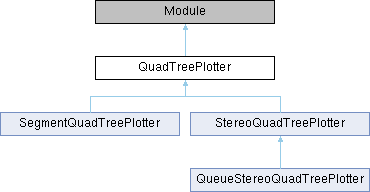
This Module is able to draw the content coming from a QuadTreeImplementation with debugOutput = True.

Definition at line 24 of file quadTreePlotter.py.

Constructor & Destructor Documentation

◆ __init__()

def __init__ (   self,
  queue 
)
Do not forget to set the ranges! Otherwise you will end up with an empty plot..

Reimplemented in QueueStereoQuadTreePlotter.

Definition at line 29 of file quadTreePlotter.py.

29 def __init__(self, queue):
30 """
31 Do not forget to set the ranges! Otherwise you will end up with an empty plot..
32 """
33 basf2.Module.__init__(self)
34
35 self.file_name_of_quad_tree_content = "output.root"
36
37 self.draw_quad_tree_content = True
38
39 self.range_x_min = 0
40
41 self.range_x_max = 0
42
43 self.range_y_min = 0
44
45 self.range_y_max = 0
46
47
48 self.queue = queue
49
50 self.file_names = []
51

Member Function Documentation

◆ event()

def event (   self)
Draw everything

Reimplemented in SegmentQuadTreePlotter, and StereoQuadTreePlotter.

Definition at line 112 of file quadTreePlotter.py.

112 def event(self):
113 """
114 Draw everything
115 """
116 self.init_plotting()
117 self.plot_quad_tree_content()
118 self.save_and_show_file()
119

◆ init_plotting()

def init_plotting (   self)
Initialize the figure with the plot ranges
We need to implement axes labels later!

Definition at line 103 of file quadTreePlotter.py.

103 def init_plotting(self):
104 """
105 Initialize the figure with the plot ranges
106 We need to implement axes labels later!
107 """
108 plt.clf()
109 plt.xlim(self.range_x_min, self.range_x_max)
110 plt.ylim(self.range_y_min, self.range_y_max)
111

◆ plot_quad_tree_content()

def plot_quad_tree_content (   self)
Draw the quad tree content coming from the root file if enabled.

Definition at line 52 of file quadTreePlotter.py.

52 def plot_quad_tree_content(self):
53 """
54 Draw the quad tree content coming from the root file if enabled.
55 """
56
57 import seaborn as sb
58
59 if not self.draw_quad_tree_content:
60 return
61
62 input_file = ROOT.TFile(self.file_name_of_quad_tree_content)
63
64 hist = input_file.Get("histUsed")
65
66 xAxis = hist.GetXaxis()
67 yAxis = hist.GetYaxis()
68
69 x_edges = np.array([xAxis.GetBinLowEdge(iX) for iX in range(1, xAxis.GetNbins() + 2)])
70 y_edges = np.array([yAxis.GetBinLowEdge(iY) for iY in range(1, yAxis.GetNbins() + 2)])
71
72 arr_l = np.array([[hist.GetBinContent(iX, iY) for iY in range(1, yAxis.GetNbins() + 1)]
73 for iX in range(1, xAxis.GetNbins() + 1)])
74
75 hist = input_file.Get("histUnused")
76
77 xAxis = hist.GetXaxis()
78 yAxis = hist.GetYaxis()
79
80 x_edges = np.array([xAxis.GetBinLowEdge(iX) for iX in range(1, xAxis.GetNbins() + 2)])
81 y_edges = np.array([yAxis.GetBinLowEdge(iY) for iY in range(1, yAxis.GetNbins() + 2)])
82
83 l2 = np.array([[hist.GetBinContent(iX, iY) for iY in range(1, yAxis.GetNbins() + 1)]
84 for iX in range(1, xAxis.GetNbins() + 1)])
85
86 cmap = sb.cubehelix_palette(8, start=2, rot=0, dark=0, light=1, reverse=False, as_cmap=True)
87
88 plt.gca().pcolorfast(x_edges, y_edges, (arr_l + l2).T, cmap=cmap)
89
90 x_labels = [f"{x:0.{int(not float(x).is_integer())}f}" if i % 4 == 0 else "" for i, x in enumerate(x_edges)]
91 plt.xticks(x_edges, x_labels)
92 y_labels = [f"{y:0.{int(not float(y).is_integer())}f}" if i % 4 == 0 else "" for i, y in enumerate(y_edges)]
93 plt.yticks(y_edges, y_labels)
94

◆ save_and_show_file()

def save_and_show_file (   self)
Save the plot to a svg and show it (maybe a png would be better?)

Reimplemented in QueueStereoQuadTreePlotter.

Definition at line 95 of file quadTreePlotter.py.

95 def save_and_show_file(self):
96 """
97 Save the plot to a svg and show it (maybe a png would be better?)
98 """
99 fileName = tempfile.gettempdir() + "/" + datetime.now().isoformat() + '.svg'
100 plt.savefig(fileName)
101 self.file_names.append(fileName)
102

◆ terminate()

def terminate (   self)
Termination signal at the end of the event processing

Reimplemented in QueueStereoQuadTreePlotter.

Definition at line 120 of file quadTreePlotter.py.

120 def terminate(self):
121 """Termination signal at the end of the event processing"""
122 self.queue.put("quadTree", self.file_names)
123
124

Member Data Documentation

◆ draw_quad_tree_content

draw_quad_tree_content

cached flag to draw QuadTree

Definition at line 37 of file quadTreePlotter.py.

◆ file_name_of_quad_tree_content

file_name_of_quad_tree_content

cached output filename

Definition at line 35 of file quadTreePlotter.py.

◆ file_names

file_names

cached array of output filenames (one file per image)

Definition at line 50 of file quadTreePlotter.py.

◆ queue

queue

cached value of the queue input parameter

Definition at line 48 of file quadTreePlotter.py.

◆ range_x_max

range_x_max

cached maximum x value

Definition at line 41 of file quadTreePlotter.py.

◆ range_x_min

range_x_min

cached minimum x value

Definition at line 39 of file quadTreePlotter.py.

◆ range_y_max

range_y_max

cached maximum y value

Definition at line 45 of file quadTreePlotter.py.

◆ range_y_min

range_y_min

cached minimum y value

Definition at line 43 of file quadTreePlotter.py.


The documentation for this class was generated from the following file: