 |
Belle II Software
light-2303-iriomote
|
 |
Belle II Software
light-2303-iriomote
|
Add custom information to the display. More...
#include <DisplayData.h>


Classes | |
| struct | Arrow |
| Stores data associated with an arrow. More... | |
Public Member Functions | |
| DisplayData () | |
| Constructor. | |
| ~DisplayData () | |
| Destructor. | |
| void | addArrow (const std::string &name, const ROOT::Math::XYZVector &start, const ROOT::Math::XYZVector &end, int color=-1) |
| Add an arrow in the display (for axes, to point out some specific location). More... | |
| void | addHistogram (const std::string &name, const TH1 *hist) |
| Add histogram with the given name. More... | |
| void | addLabel (const std::string &text, const ROOT::Math::XYZVector &pos) |
| Add a text label at the given position. | |
| void | addPoint (const std::string &name, const ROOT::Math::XYZVector &pos) |
| Add a point at the given position, as part of a collection specified by name. More... | |
| void | select (const TObject *object) |
| Select the given object in the display. More... | |
Private Member Functions | |
| ClassDef (DisplayData, 5) | |
| Add custom information to the display. | |
Private Attributes | |
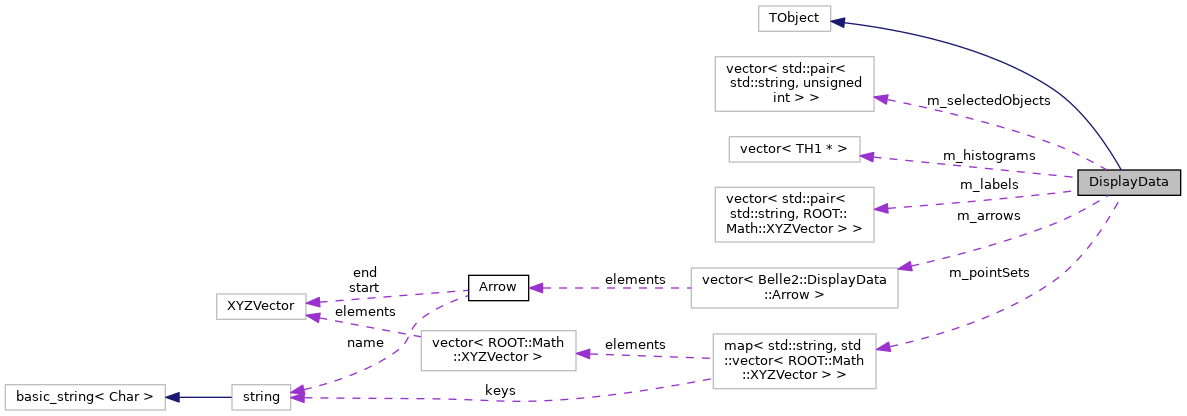
| std::map< std::string, std::vector< ROOT::Math::XYZVector > > | m_pointSets |
| name -> points map | |
| std::vector< std::pair< std::string, ROOT::Math::XYZVector > > | m_labels |
| text labels (to be shown at a given position). | |
| std::vector< TH1 * > | m_histograms |
| Histograms to be shown in Eve. | |
| std::vector< std::pair< std::string, unsigned int > > | m_selectedObjects |
| List of selected objects (array name, index). | |
| std::vector< Arrow > | m_arrows |
| List of arrows. | |
Friends | |
| class | DisplayUI |
| class | EVEVisualization |
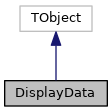
Add custom information to the display.
To use it, simply create a DisplayData object using StoreObjPtr and call the functions to add custom data. For example:
You can then save the output of your module to a file and view it with 'b2display', or look at it directly after execution by adding the Display module in your steering file.
Definition at line 55 of file DisplayData.h.
| void addArrow | ( | const std::string & | name, |
| const ROOT::Math::XYZVector & | start, | ||
| const ROOT::Math::XYZVector & | end, | ||
| int | color = -1 |
||
| ) |
Add an arrow in the display (for axes, to point out some specific location).
| name | Text to be shown beside arrow. |
| start | The arrow will start here. |
| end | The pointy end ends up here. |
| color | Color_t to use for this object, default: random color. |
Definition at line 24 of file DisplayData.cc.
| void addHistogram | ( | const std::string & | name, |
| const TH1 * | hist | ||
| ) |
Add histogram with the given name.
The histogram will show up in the 'Histograms' tab and can be drawn on the active canvas by double-clicking it.
Definition at line 39 of file DisplayData.cc.
| void addPoint | ( | const std::string & | name, |
| const ROOT::Math::XYZVector & | pos | ||
| ) |
Add a point at the given position, as part of a collection specified by name.
All points with the same name will be highlighted when clicked etc.
Definition at line 29 of file DisplayData.cc.
| void select | ( | const TObject * | object | ) |
Select the given object in the display.
Only has an effect if the object actually has a visualisation. Can be called multiple times to select more than one object.
| object | object to select, must be inside a StoreArray |
Definition at line 46 of file DisplayData.cc.