 |
Belle II Software light-2406-ragdoll
|
 |
Belle II Software light-2406-ragdoll
|


Public Member Functions | |
| def | __init__ (self, figure=None) |
| def | add (self, data, columns, signal_mask, bckgrd_mask) |
| def | finish (self) |
Public Attributes | |
| figure | |
| create figure | |
| signal_axis | |
| add signal subplot | |
| bckgrd_axis | |
| add background subplot | |
| colorbar_axis | |
| Colorbar axis contains the colorbar. | |
| axis | |
| Usual axis object which every Plotter object needs, here it is just a dummy. | |
Static Public Attributes | |
| None | figure = None |
| figure which is used to draw | |
| None | signal_axis = None |
| Main axis which shows the correlation of the signal samples. | |
| None | bckgrd_axis = None |
| Axis which shows the correlation of the background samples. | |
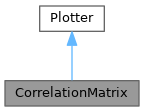
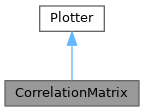
Plots correlation matrix
Definition at line 1242 of file plotting.py.
| def __init__ | ( | self, | |
figure = None |
|||
| ) |
Creates a new figure if None is given, sets the default plot parameters
@param figure default draw figure which is used
Reimplemented from Plotter.
Definition at line 1253 of file plotting.py.
| def add | ( | self, | |
| data, | |||
| columns, | |||
| signal_mask, | |||
| bckgrd_mask | |||
| ) |
Add a new correlation plot.
@param data pandas.DataFrame containing all data
@param columns which are used to calculate the correlations
Reimplemented from Plotter.
Definition at line 1277 of file plotting.py.
| def finish | ( | self | ) |
Sets limits, title, axis-labels and legend of the plot
Reimplemented from Plotter.
Definition at line 1340 of file plotting.py.
| axis |
Usual axis object which every Plotter object needs, here it is just a dummy.
Definition at line 1273 of file plotting.py.
|
static |
Axis which shows the correlation of the background samples.
Definition at line 1251 of file plotting.py.
| bckgrd_axis |
add background subplot
Definition at line 1269 of file plotting.py.
| colorbar_axis |
Colorbar axis contains the colorbar.
Definition at line 1271 of file plotting.py.
|
static |
figure which is used to draw
Definition at line 1247 of file plotting.py.
| figure |
create figure
Definition at line 1260 of file plotting.py.
|
static |
Main axis which shows the correlation of the signal samples.
Definition at line 1249 of file plotting.py.
| signal_axis |
add signal subplot
Definition at line 1267 of file plotting.py.