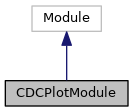
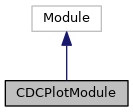
An example python module.

It gathers the x/y position off all CDCSimHits and draws them using
matplotlib. The result is saved as a PNG.
Definition at line 61 of file cdcplotmodule.py.
◆ event()
reimplementation of Module::event().

loops over the CDCSimHits in the current event.
Definition at line 71 of file cdcplotmodule.py.
72 """reimplementation of Module::event().
74 loops over the CDCSimHits in the current event.
84 mcpart = hit.getRelatedFrom(
"MCParticles")
85 if mcpart
not in mcparts:
86 mcparts.append(mcpart)
87 trackhits_x.append([])
88 trackhits_y.append([])
90 idx = mcparts.index(mcpart)
91 hitpos = hit.getPosWire()
92 trackhits_x[idx].append(hitpos.x())
93 trackhits_y[idx].append(hitpos.y())
98 col = [colormap.jet(1.0 * c / (npart - 1))
for c
in range(npart)]
99 fig =
plot(trackhits_x, trackhits_y, col)
101 filename =
'cdchits_%i.png' % (self.num_events)
102 if os.path.lexists(filename):
103 B2WARNING(filename +
' exists, overwriting ...')
105 B2INFO(
'creating ' + filename +
' ...')
106 fig.savefig(filename)
◆ terminate()
The documentation for this class was generated from the following file:


