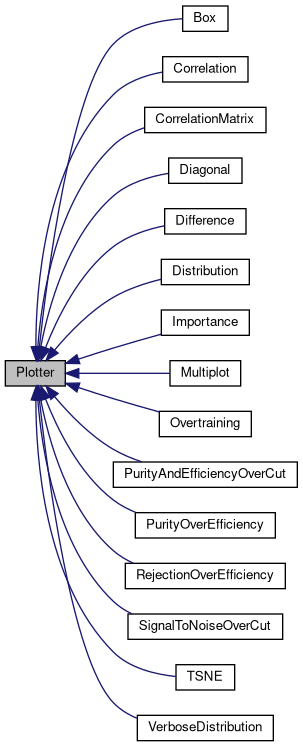
|
| def | __init__ (self, figure=None, axis=None) |
| |
| def | add_subplot (self, gridspecs) |
| |
| def | save (self, filename) |
| |
| def | set_plot_options (self, plot_kwargs={ 'linestyle':''}) |
| |
| def | set_errorbar_options (self, errorbar_kwargs={ 'fmt':'.', 'elinewidth':3, 'alpha':1}) |
| | Overrides default errorbar options for datapoint errorbars. More...
|
| |
| def | set_errorband_options (self, errorband_kwargs={ 'alpha':0.5}) |
| |
| def | set_fill_options (self, fill_kwargs=None) |
| |
| def | add (self, *args, **kwargs) |
| |
| def | finish (self, *args, **kwargs) |
| |
| def | scale_limits (self) |
| |
|
|
| plots = None |
| | Plots added to the axis so far.
|
| |
|
| labels = None |
| | Labels of the plots added so far.
|
| |
|
| xmin = None |
| | Minimum x value.
|
| |
|
| xmax = None |
| | Maximum x value.
|
| |
|
| ymin = None |
| | Minimum y value.
|
| |
|
| ymax = None |
| | Maximum y value.
|
| |
|
float | yscale = 0.0 |
| | limit scale
|
| |
|
float | xscale = 0.0 |
| | limit scale
|
| |
|
| figure = None |
| | figure which is used to draw
|
| |
|
| axis = None |
| | Main axis which is used to draw.
|
| |
Base class for all Plotters.
Definition at line 43 of file plotting.py.
◆ __init__()
| def __init__ |
( |
|
self, |
|
|
|
figure = None, |
|
|
|
axis = None |
|
) |
| |
Creates a new figure and axis if None is given, sets the default plot parameters
@param figure default draw figure which is used
@param axis default draw axis which is used
Reimplemented in Box.
Definition at line 77 of file plotting.py.
77 def __init__(self, figure=None, axis=None):
79 Creates a new figure and axis if None is given, sets the default plot parameters
80 @param figure default draw figure which is used
81 @param axis default draw axis which is used
83 b2.B2INFO(
"Create new figure for class " + str(type(self)))
85 self.figure = matplotlib.figure.Figure(figsize=(32, 18))
86 self.figure.set_tight_layout(
False)
91 self.axis = self.figure.add_subplot(1, 1, 1)
97 self.xmin, self.xmax = float(0), float(1)
98 self.ymin, self.ymax = float(0), float(1)
105 self.plot_kwargs =
None
107 self.errorbar_kwargs =
None
109 self.errorband_kwargs =
None
111 self.fill_kwargs =
None
113 self.set_plot_options()
114 self.set_errorbar_options()
115 self.set_errorband_options()
116 self.set_fill_options()
◆ _plot_datapoints()
| def _plot_datapoints |
( |
|
self, |
|
|
|
axis, |
|
|
|
x, |
|
|
|
y, |
|
|
|
xerr = None, |
|
|
|
yerr = None |
|
) |
| |
|
private |
Plot the given datapoints, with plot, errorbar and make a errorband with fill_between
@param x coordinates of the data points
@param y coordinates of the data points
@param xerr symmetric error on x data points
@param yerr symmetric error on y data points
Definition at line 173 of file plotting.py.
◆ add()
| def add |
( |
|
self, |
|
|
* |
args, |
|
|
** |
kwargs |
|
) |
| |
Add a new plot to this plotter
Definition at line 241 of file plotting.py.
◆ add_subplot()
| def add_subplot |
( |
|
self, |
|
|
|
gridspecs |
|
) |
| |
Adds a new subplot to the figure, updates all other axes
according to the given gridspec
@param gridspecs gridspecs for all axes including the new one
Definition at line 118 of file plotting.py.
◆ finish()
| def finish |
( |
|
self, |
|
|
* |
args, |
|
|
** |
kwargs |
|
) |
| |
Finish plotting and set labels, legends and stuff
Definition at line 247 of file plotting.py.
◆ save()
| def save |
( |
|
self, |
|
|
|
filename |
|
) |
| |
Save the figure into a file
@param filename of the file
Definition at line 130 of file plotting.py.
◆ scale_limits()
Scale limits to increase distance to boundaries
Definition at line 253 of file plotting.py.
◆ set_errorband_options()
| def set_errorband_options |
( |
|
self, |
|
|
|
errorband_kwargs = {'alpha': 0.5} |
|
) |
| |
Overrides default errorband options for datapoint errorband
@param errorbar_kwargs keyword arguments for the fill_between function
Definition at line 157 of file plotting.py.
◆ set_errorbar_options()
| def set_errorbar_options |
( |
|
self, |
|
|
|
errorbar_kwargs = {'fmt': '.', 'elinewidth': 3, 'alpha': 1} |
|
) |
| |
Overrides default errorbar options for datapoint errorbars.
Overrides default errorbar options for datapoint errorbars
@param errorbar_kwargs keyword arguments for the errorbar function
Definition at line 149 of file plotting.py.
◆ set_fill_options()
| def set_fill_options |
( |
|
self, |
|
|
|
fill_kwargs = None |
|
) |
| |
Overrides default fill_between options for datapoint errorband
@param fill_kwargs keyword arguments for the fill_between function
Definition at line 165 of file plotting.py.
◆ set_plot_options()
| def set_plot_options |
( |
|
self, |
|
|
|
plot_kwargs = {'linestyle': ''} |
|
) |
| |
Overrides default plot options for datapoint plot
@param plot_kwargs keyword arguments for the plot function
Definition at line 141 of file plotting.py.
The documentation for this class was generated from the following file:


