|
|
list | hist = [TH1F('h' + str(i), 'wf', 64 * 4, 0.0, 64.0 * 4) for i in range(4)] |
| | 1D histograms
|
| |
|
list | gpaint = [TGraph() for i in range(4)] |
| | graphs for painting waveforms after the gap in window number
|
| |
|
list | graphs = [[TGraph(5)] for i in range(4)] |
| | graphs for FE points
|
| |
|
list | tlpfgraphs = [[TGraph(2)] for i in range(4)] |
| | graphs for template fit points
|
| |
|
| c1 = TCanvas('c1', 'WF event display', 800, 800) |
| | canvas
|
| |
|
string | pdfFile = 'waveforms' |
| | output file name
|
| |
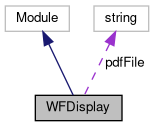
Simple event display of waveforms with feature extraction points
Definition at line 26 of file showFEWaveforms.py.
◆ draw()
| def draw |
( |
|
self, |
|
|
|
k, |
|
|
|
event, |
|
|
|
run |
|
) |
| |
Draw histograms and wait for user respond
Definition at line 74 of file showFEWaveforms.py.
74 def draw(self, k, event, run):
75 ''' Draw histograms and wait for user respond '''
79 title =
'WF event display:' +
' run ' + str(run) +
' event ' \
81 self.c1.SetTitle(title)
85 if self.gpaint[i].GetN() > 0:
86 self.gpaint[i].Draw(
"same")
87 for graph
in self.graphs[i]:
89 for tlpfgraph
in self.tlpfgraphs[i]:
90 tlpfgraph.Draw(
"sameP")
◆ event()
Event processor: fill the histograms, display them,
wait for user respond.
Definition at line 121 of file showFEWaveforms.py.
◆ initialize()
◆ set_gpaint()
| def set_gpaint |
( |
|
self, |
|
|
|
waveform, |
|
|
|
k |
|
) |
| |
construct a graph to paint waveform differently after window discontinuity
Definition at line 95 of file showFEWaveforms.py.
◆ wait()
The documentation for this class was generated from the following file:


