|
Belle II Software release-09-00-03
|
|
Belle II Software release-09-00-03
|

Public Member Functions | |
| def | __init__ (self, cls, number_of_plots, figure=None) |
| def | add (self, i, *args, **kwargs) |
| def | finish (self) |
Public Attributes | |
| figure | |
| create figure | |
| sub_plots | |
| the subplots which are displayed in the grid | |
| axis | |
| the axis of the first subplot | |
Static Public Attributes | |
| None | figure = None |
| figure which is used to draw | |
| None | axis = None |
| Main axis. | |
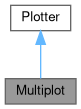
Plots multiple other plots into a grid 3x?
Definition at line 488 of file plotting.py.
| def __init__ | ( | self, | |
| cls, | |||
| number_of_plots, | |||
figure = None |
|||
| ) |
Creates a new figure if None is given, sets the default plot parameters
@param figure default draw figure which is used
Reimplemented from Plotter.
Definition at line 497 of file plotting.py.
| def add | ( | self, | |
| i, | |||
| * | args, | ||
| ** | kwargs | ||
| ) |
Call add function of ith subplot
@param i position of the subplot
Reimplemented from Plotter.
Definition at line 524 of file plotting.py.
| def finish | ( | self | ) |
Sets limits, title, axis-labels and legend of the plot
Reimplemented from Plotter.
Definition at line 531 of file plotting.py.
|
static |
Main axis.
Definition at line 495 of file plotting.py.
| axis |
the axis of the first subplot
Definition at line 521 of file plotting.py.
|
static |
figure which is used to draw
Definition at line 493 of file plotting.py.
| figure |
create figure
Definition at line 504 of file plotting.py.
| sub_plots |
the subplots which are displayed in the grid
Definition at line 519 of file plotting.py.