Belle II Software development
Plotter Class Reference
Inheritance diagram for Plotter:
Box Correlation CorrelationMatrix Diagonal Difference Distribution Importance Multiplot Overtraining PrecisionRecallCurve PurityAndEfficiencyOverCut PurityOverEfficiency RejectionOverEfficiency SignalToNoiseOverCut TSNE TrueVsFalsePositiveRate VerboseDistribution

Public Member Functions

 __init__ (self, figure=None, axis=None, dpi=None)
 
 add_subplot (self, gridspecs)
 
 save (self, filename)
 
 set_plot_options (self, plot_kwargs={ 'linestyle':''})
 
 set_errorbar_options (self, errorbar_kwargs={ 'fmt':'.', 'elinewidth':3, 'alpha':1})
 Overrides default errorbar options for datapoint errorbars.
 
 set_errorband_options (self, errorband_kwargs={ 'alpha':0.5})
 
 set_fill_options (self, fill_kwargs=None)
 
 add (self, *args, **kwargs)
 
 setAxisLimits (self, factor=0.0)
 
 finish (self, *args, **kwargs)
 
 scale_limits (self)
 

Public Attributes

 dpi = dpi
 set default dpi
 
 plot_kwargs = None
 create figure
 
 errorbar_kwargs = None
 Default keyword arguments for errorbar function.
 
 errorband_kwargs = None
 Default keyword arguments for errorband function.
 
 fill_kwargs = None
 Default keyword arguments for fill_between function.
 
 prop_cycler = itertools.cycle(plt.rcParams["axes.prop_cycle"])
 Property cycler used to give plots unique colors.
 

Static Public Attributes

list plots = None
 Plots added to the axis so far.
 
list labels = None
 Labels of the plots added so far.
 
 xmin = None
 Minimum x value.
 
 xmax = None
 Maximum x value.
 
 ymin = None
 Minimum y value.
 
 ymax = None
 Maximum y value.
 
float yscale = 0.0
 create figure
 
float xscale = 0.0
 create figure
 
 figure = None
 figure which is used to draw
 
 axis = None
 Main axis which is used to draw.
 

Protected Member Functions

 _plot_datapoints (self, axis, x, y, xerr=None, yerr=None)
 

Detailed Description

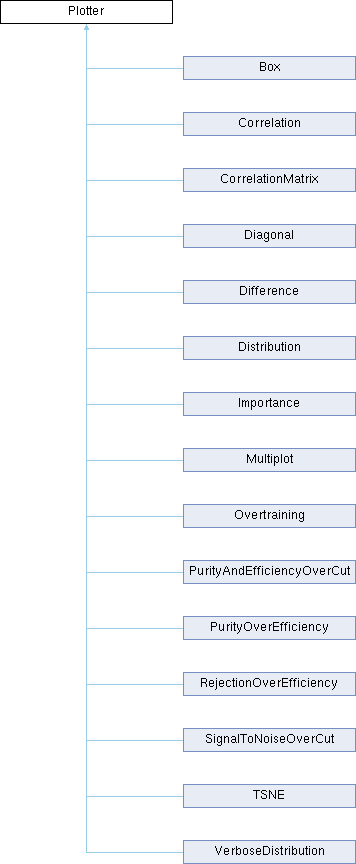
Base class for all Plotters.

Definition at line 43 of file plotting.py.

Constructor & Destructor Documentation

◆ __init__()

__init__ ( self,
figure = None,
axis = None,
dpi = None )
Creates a new figure and axis if None is given, sets the default plot parameters @param figure default draw figure which is used @param axis default draw axis which is used @param dpi dpi for the matplotlib figure, if None default is used

Definition at line 77 of file plotting.py.

77 def __init__(self, figure=None, axis=None, dpi=None):
78 """
79 Creates a new figure and axis if None is given, sets the default plot parameters
80 @param figure default draw figure which is used
81 @param axis default draw axis which is used
82 @param dpi dpi for the matplotlib figure, if None default is used
83 """
84 b2.B2INFO("Create new figure for class " + str(type(self)))
85
86 self.dpi = dpi
87 if figure is None:
88
89 self.figure = matplotlib.figure.Figure(figsize=(12, 8), dpi=dpi)
90 else:
91 self.figure = figure
92
93 if axis is None:
94
95 self.axis = self.figure.add_subplot(1, 1, 1)
96 else:
97 self.axis = axis
98
99
100 self.plots = []
101
102 self.labels = []
103
104 self.xmin, self.xmax = float(0), float(1)
105
106 self.ymin, self.ymax = float(0), float(1)
107
108 self.yscale = 0.1
109
110 self.xscale = 0.0
111
112
113 self.plot_kwargs = None
114
115 self.errorbar_kwargs = None
116
117 self.errorband_kwargs = None
118
119 self.fill_kwargs = None
120
121 self.set_plot_options()
122 self.set_errorbar_options()
123 self.set_errorband_options()
124 self.set_fill_options()
125
126
127 self.prop_cycler = itertools.cycle(plt.rcParams["axes.prop_cycle"])
128

Member Function Documentation

◆ _plot_datapoints()

_plot_datapoints ( self,
axis,
x,
y,
xerr = None,
yerr = None )
protected
Plot the given datapoints, with plot, errorbar and make a errorband with fill_between @param x coordinates of the data points @param y coordinates of the data points @param xerr symmetric error on x data points @param yerr symmetric error on y data points

Definition at line 184 of file plotting.py.

184 def _plot_datapoints(self, axis, x, y, xerr=None, yerr=None):
185 """
186 Plot the given datapoints, with plot, errorbar and make a errorband with fill_between
187 @param x coordinates of the data points
188 @param y coordinates of the data points
189 @param xerr symmetric error on x data points
190 @param yerr symmetric error on y data points
191 """
192 p = e = f = None
193 plot_kwargs = copy.copy(self.plot_kwargs)
194 errorbar_kwargs = copy.copy(self.errorbar_kwargs)
195 errorband_kwargs = copy.copy(self.errorband_kwargs)
196 fill_kwargs = copy.copy(self.fill_kwargs)
197
198 if plot_kwargs is None or 'color' not in plot_kwargs:
199 color = next(self.prop_cycler)
200 color = color['color']
201 plot_kwargs['color'] = color
202 else:
203 color = plot_kwargs['color']
204 color = matplotlib.colors.ColorConverter().to_rgb(color)
205 patch = matplotlib.patches.Patch(color=color, alpha=0.5)
206 patch.get_color = patch.get_facecolor
207 patches = [patch]
208
209 if plot_kwargs is not None:
210 p, = axis.plot(x, y, rasterized=True, **plot_kwargs)
211 patches.append(p)
212
213 if errorbar_kwargs is not None and (xerr is not None or yerr is not None):
214 if 'color' not in errorbar_kwargs:
215 errorbar_kwargs['color'] = color
216 if 'ecolor' not in errorbar_kwargs:
217 errorbar_kwargs['ecolor'] = [0.5 * x for x in color]
218
219 # fully mask nan values.
220 # Needed until https://github.com/matplotlib/matplotlib/pull/23333 makes it into the externals.
221 # TODO: remove in release 8.
222 if not isinstance(xerr, (numpy.ndarray, list)):
223 xerr = xerr*numpy.ones(len(x))
224 if not isinstance(yerr, (numpy.ndarray, list)):
225 yerr = yerr*numpy.ones(len(y))
226 mask = numpy.logical_and.reduce([numpy.isfinite(v) for v in [x, y, xerr, yerr]])
227
228 e = axis.errorbar(
229 x[mask], y[mask], xerr=numpy.where(
230 xerr[mask] < 0, 0.0, xerr[mask]), yerr=numpy.where(
231 yerr[mask] < 0, 0.0, yerr[mask]), rasterized=True, **errorbar_kwargs)
232 patches.append(e)
233
234 if errorband_kwargs is not None and yerr is not None:
235 if 'color' not in errorband_kwargs:
236 errorband_kwargs['color'] = color
237 if xerr is not None:
238 # Ensure that xerr and yerr are iterable numpy arrays
239 xerr = x + xerr - x
240 yerr = y + yerr - y
241 for _x, _y, _xe, _ye in zip(x, y, xerr, yerr):
242 axis.add_patch(matplotlib.patches.Rectangle((_x - _xe, _y - _ye), 2 * _xe, 2 * _ye, rasterized=True,
243 **errorband_kwargs))
244 else:
245 f = axis.fill_between(x, y - yerr, y + yerr, interpolate=True, rasterized=True, **errorband_kwargs)
246
247 if fill_kwargs is not None:
248 # to fill the last bin of a histogram
249 x = numpy.append(x, x[-1]+2*xerr[-1])
250 y = numpy.append(y, y[-1])
251 xerr = numpy.append(xerr, xerr[-1])
252
253 axis.fill_between(x-xerr, y, 0, rasterized=True, **fill_kwargs)
254
255 return (tuple(patches), p, e, f)
256

◆ add()

add ( self,
* args,
** kwargs )
Add a new plot to this plotter

Reimplemented in Box, Correlation, CorrelationMatrix, Diagonal, Difference, Distribution, Importance, Multiplot, Overtraining, PrecisionRecallCurve, PurityAndEfficiencyOverCut, PurityOverEfficiency, RejectionOverEfficiency, SignalToNoiseOverCut, TrueVsFalsePositiveRate, TSNE, and VerboseDistribution.

Definition at line 257 of file plotting.py.

257 def add(self, *args, **kwargs):
258 """
259 Add a new plot to this plotter
260 """
261 return NotImplemented
262

◆ add_subplot()

add_subplot ( self,
gridspecs )
Adds a new subplot to the figure, updates all other axes according to the given gridspec @param gridspecs gridspecs for all axes including the new one

Definition at line 129 of file plotting.py.

129 def add_subplot(self, gridspecs):
130 """
131 Adds a new subplot to the figure, updates all other axes
132 according to the given gridspec
133 @param gridspecs gridspecs for all axes including the new one
134 """
135 for gs, ax in zip(gridspecs[:-1], self.figure.axes):
136 ax.set_position(gs.get_position(self.figure))
137 ax.set_subplotspec(gs)
138 axis = self.figure.add_subplot(gridspecs[-1], sharex=self.axis)
139 return axis
140

◆ finish()

finish ( self,
* args,
** kwargs )
Finish plotting and set labels, legends and stuff

Reimplemented in Box, Correlation, CorrelationMatrix, Diagonal, Difference, Distribution, Importance, Multiplot, Overtraining, PrecisionRecallCurve, PurityAndEfficiencyOverCut, PurityOverEfficiency, RejectionOverEfficiency, SignalToNoiseOverCut, TrueVsFalsePositiveRate, TSNE, and VerboseDistribution.

Definition at line 275 of file plotting.py.

275 def finish(self, *args, **kwargs):
276 """
277 Finish plotting and set labels, legends and stuff
278 """
279 return NotImplemented
280

◆ save()

save ( self,
filename )
Save the figure into a file @param filename of the file

Definition at line 141 of file plotting.py.

141 def save(self, filename):
142 """
143 Save the figure into a file
144 @param filename of the file
145 """
146 b2.B2INFO("Save figure for class " + str(type(self)))
147 from matplotlib.backends.backend_agg import FigureCanvasAgg as FigureCanvas
148 canvas = FigureCanvas(self.figure)
149 canvas.print_figure(filename, dpi=self.dpi, bbox_inches='tight')
150 return self
151

◆ scale_limits()

scale_limits ( self)
Scale limits to increase distance to boundaries

Definition at line 281 of file plotting.py.

281 def scale_limits(self):
282 """
283 Scale limits to increase distance to boundaries
284 """
285 self.ymin *= 1.0 - math.copysign(self.yscale, self.ymin)
286 self.ymax *= 1.0 + math.copysign(self.yscale, self.ymax)
287 self.xmin *= 1.0 - math.copysign(self.xscale, self.xmin)
288 self.xmax *= 1.0 + math.copysign(self.xscale, self.xmax)
289 return self
290
291

◆ set_errorband_options()

set_errorband_options ( self,
errorband_kwargs = {'alpha': 0.5} )
Overrides default errorband options for datapoint errorband @param errorbar_kwargs keyword arguments for the fill_between function

Definition at line 168 of file plotting.py.

168 def set_errorband_options(self, errorband_kwargs={'alpha': 0.5}):
169 """
170 Overrides default errorband options for datapoint errorband
171 @param errorbar_kwargs keyword arguments for the fill_between function
172 """
173 self.errorband_kwargs = copy.copy(errorband_kwargs)
174 return self
175

◆ set_errorbar_options()

set_errorbar_options ( self,
errorbar_kwargs = {'fmt': '.', 'elinewidth': 3, 'alpha': 1} )

Overrides default errorbar options for datapoint errorbars.

Overrides default errorbar options for datapoint errorbars @param errorbar_kwargs keyword arguments for the errorbar function

Definition at line 160 of file plotting.py.

160 def set_errorbar_options(self, errorbar_kwargs={'fmt': '.', 'elinewidth': 3, 'alpha': 1}):
161 """
162 Overrides default errorbar options for datapoint errorbars
163 @param errorbar_kwargs keyword arguments for the errorbar function
164 """
165 self.errorbar_kwargs = copy.copy(errorbar_kwargs)
166 return self
167

◆ set_fill_options()

set_fill_options ( self,
fill_kwargs = None )
Overrides default fill_between options for datapoint errorband @param fill_kwargs keyword arguments for the fill_between function

Definition at line 176 of file plotting.py.

176 def set_fill_options(self, fill_kwargs=None):
177 """
178 Overrides default fill_between options for datapoint errorband
179 @param fill_kwargs keyword arguments for the fill_between function
180 """
181 self.fill_kwargs = copy.copy(fill_kwargs)
182 return self
183

◆ set_plot_options()

set_plot_options ( self,
plot_kwargs = {'linestyle': ''} )
Overrides default plot options for datapoint plot @param plot_kwargs keyword arguments for the plot function

Definition at line 152 of file plotting.py.

152 def set_plot_options(self, plot_kwargs={'linestyle': ''}):
153 """
154 Overrides default plot options for datapoint plot
155 @param plot_kwargs keyword arguments for the plot function
156 """
157 self.plot_kwargs = copy.copy(plot_kwargs)
158 return self
159

◆ setAxisLimits()

setAxisLimits ( self,
factor = 0.0 )
Sets the limits of the axis with an optional expansion factor. Parameters: factor (float): Fraction by which to expand the axis limits beyond the data range.

Definition at line 263 of file plotting.py.

263 def setAxisLimits(self, factor=0.0):
264 """
265 Sets the limits of the axis with an optional expansion factor.
266
267 Parameters:
268 factor (float): Fraction by which to expand the axis limits beyond the data range.
269 """
270 dx = self.xmax - self.xmin
271 dy = self.ymax - self.ymin
272 self.axis.set_xlim((self.xmin - factor*dx, self.xmax + factor*dx))
273 self.axis.set_ylim((self.ymin - factor*dy, self.ymax + factor*dy))
274

Member Data Documentation

◆ axis

axis = None
static

Main axis which is used to draw.

divide figure into subplots

Definition at line 75 of file plotting.py.

◆ dpi

dpi = dpi

set default dpi

Definition at line 86 of file plotting.py.

◆ errorband_kwargs

errorband_kwargs = None

Default keyword arguments for errorband function.

Definition at line 117 of file plotting.py.

◆ errorbar_kwargs

errorbar_kwargs = None

Default keyword arguments for errorbar function.

Definition at line 115 of file plotting.py.

◆ figure

figure = None
static

figure which is used to draw

Definition at line 73 of file plotting.py.

◆ fill_kwargs

fill_kwargs = None

Default keyword arguments for fill_between function.

Definition at line 119 of file plotting.py.

◆ labels

list labels = None
static

Labels of the plots added so far.

divide figure into subplots

create empty list for plots

create empty list for labels

Definition at line 61 of file plotting.py.

◆ plot_kwargs

plot_kwargs = None

create figure

divide figure into subplots

create empty list for plots

create empty list for labels

set x limits

set y limits

y limit scale

x limit scale

Default keyword arguments for plot function

Definition at line 113 of file plotting.py.

◆ plots

list plots = None
static

Plots added to the axis so far.

divide figure into subplots

create empty list for plots

Definition at line 59 of file plotting.py.

◆ prop_cycler

prop_cycler = itertools.cycle(plt.rcParams["axes.prop_cycle"])

Property cycler used to give plots unique colors.

Definition at line 127 of file plotting.py.

◆ xmax

xmax = None
static

Maximum x value.

divide figure into subplots

create empty list for plots

create empty list for labels

set x limits

Definition at line 65 of file plotting.py.

◆ xmin

xmin = None
static

Minimum x value.

create figure

divide figure into subplots

create empty list for plots

create empty list for labels

set x limits

Definition at line 63 of file plotting.py.

◆ xscale

float xscale = 0.0
static

create figure

limit scale

divide figure into subplots

create empty list for plots

create empty list for labels

set x limits

set y limits

y limit scale

x limit scale

Definition at line 71 of file plotting.py.

◆ ymax

ymax = None
static

Maximum y value.

divide figure into subplots

create empty list for plots

create empty list for labels

set x limits

set y limits

Definition at line 69 of file plotting.py.

◆ ymin

ymin = None
static

Minimum y value.

create figure

divide figure into subplots

create empty list for plots

create empty list for labels

set x limits

set y limits

Definition at line 67 of file plotting.py.

◆ yscale

float yscale = 0.0
static

create figure

limit scale

divide figure into subplots

create empty list for plots

create empty list for labels

set x limits

set y limits

y limit scale

Definition at line 70 of file plotting.py.


The documentation for this class was generated from the following file: