Belle II Software light-2405-quaxo
Overtraining Class Reference
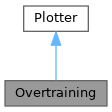
Inheritance diagram for Overtraining:
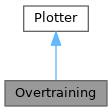
Collaboration diagram for Overtraining:

Public Member Functions

def __init__ (self, figure=None)
 
def add (self, data, column, train_mask, test_mask, signal_mask, bckgrd_mask, weight_column=None)
 
def finish (self)
 

Public Attributes

 figure
 create figure
 
 axis
 define first subplot
 
 axis_d1
 define second subplot
 
 axis_d2
 define third subplot
 

Static Public Attributes

None figure = None
 figure which is used to draw
 
None axis = None
 Main axis which is used to draw.
 
None axis_d1 = None
 Axis which shows the difference between training and test signal.
 
None axis_d2 = None
 Axis which shows the difference between training and test background.
 

Detailed Description

Create TMVA-like overtraining control plot for a classification training

Definition at line 851 of file plotting.py.

Constructor & Destructor Documentation

◆ __init__()

def __init__ (   self,
  figure = None 
)
Creates a new figure if None is given, sets the default plot parameters
@param figure default draw figure which is used

Reimplemented from Plotter.

Definition at line 865 of file plotting.py.

865 def __init__(self, figure=None):
866 """
867 Creates a new figure if None is given, sets the default plot parameters
868 @param figure default draw figure which is used
869 """
870 if figure is None:
871
872 self.figure = matplotlib.figure.Figure(figsize=(32, 18))
873 self.figure.set_tight_layout(True)
874 else:
875 self.figure = figure
876
877 gs = matplotlib.gridspec.GridSpec(5, 1)
878
879 self.axis = self.figure.add_subplot(gs[:3, :])
880
881 self.axis_d1 = self.figure.add_subplot(gs[3, :], sharex=self.axis)
882
883 self.axis_d2 = self.figure.add_subplot(gs[4, :], sharex=self.axis)
884
885 super().__init__(self.figure, self.axis)
886

Member Function Documentation

◆ add()

def add (   self,
  data,
  column,
  train_mask,
  test_mask,
  signal_mask,
  bckgrd_mask,
  weight_column = None 
)
Add a new overtraining plot, I recommend to draw only one overtraining plot at the time,
otherwise there are too many curves in the plot to recognize anything in the plot.
@param data pandas.DataFrame containing all data
@param column which is used to calculate distribution histogram
@param train_mask boolean numpy.array defining which events are training events
@param test_mask boolean numpy.array defining which events are test events
@param signal_mask boolean numpy.array defining which events are signal events
@param bckgrd_mask boolean numpy.array defining which events are background events
@param weight_column column in data containing the weights for each event

Reimplemented from Plotter.

Definition at line 887 of file plotting.py.

887 def add(self, data, column, train_mask, test_mask, signal_mask, bckgrd_mask, weight_column=None):
888 """
889 Add a new overtraining plot, I recommend to draw only one overtraining plot at the time,
890 otherwise there are too many curves in the plot to recognize anything in the plot.
891 @param data pandas.DataFrame containing all data
892 @param column which is used to calculate distribution histogram
893 @param train_mask boolean numpy.array defining which events are training events
894 @param test_mask boolean numpy.array defining which events are test events
895 @param signal_mask boolean numpy.array defining which events are signal events
896 @param bckgrd_mask boolean numpy.array defining which events are background events
897 @param weight_column column in data containing the weights for each event
898 """
899 distribution = Distribution(self.figure, self.axis, normed_to_all_entries=True)
900
901 distribution.set_plot_options(self.plot_kwargs)
902 distribution.set_errorbar_options(self.errorbar_kwargs)
903 distribution.set_errorband_options(self.errorband_kwargs)
904 distribution.add(data, column, test_mask & signal_mask, weight_column)
905 distribution.add(data, column, test_mask & bckgrd_mask, weight_column)
906
907 distribution.set_plot_options(
908 {'color': distribution.plots[0][0][0].get_color(), 'linestyle': '-', 'lw': 4, 'drawstyle': 'steps-mid'})
909 distribution.set_fill_options({'color': distribution.plots[0][0][0].get_color(), 'alpha': 0.5, 'step': 'post'})
910 distribution.set_errorbar_options(None)
911 distribution.set_errorband_options(None)
912 distribution.add(data, column, train_mask & signal_mask, weight_column)
913 distribution.set_plot_options(
914 {'color': distribution.plots[1][0][0].get_color(), 'linestyle': '-', 'lw': 4, 'drawstyle': 'steps-mid'})
915 distribution.set_fill_options({'color': distribution.plots[1][0][0].get_color(), 'alpha': 0.5, 'step': 'post'})
916 distribution.add(data, column, train_mask & bckgrd_mask, weight_column)
917
918 distribution.labels = ['Test-Signal', 'Test-Background', 'Train-Signal', 'Train-Background']
919 distribution.finish()
920
921 self.plot_kwargs['color'] = distribution.plots[0][0][0].get_color()
922 difference_signal = Difference(self.figure, self.axis_d1, shift_to_zero=True, normed=True)
923 difference_signal.set_plot_options(self.plot_kwargs)
924 difference_signal.set_errorbar_options(self.errorbar_kwargs)
925 difference_signal.set_errorband_options(self.errorband_kwargs)
926 difference_signal.add(data, column, train_mask & signal_mask, test_mask & signal_mask, weight_column)
927 self.axis_d1.set_xlim((difference_signal.xmin, difference_signal.xmax))
928 self.axis_d1.set_ylim((difference_signal.ymin, difference_signal.ymax))
929 difference_signal.plots = difference_signal.labels = []
930 difference_signal.finish(line_color=distribution.plots[0][0][0].get_color())
931
932 self.plot_kwargs['color'] = distribution.plots[1][0][0].get_color()
933 difference_bckgrd = Difference(self.figure, self.axis_d2, shift_to_zero=True, normed=True)
934 difference_bckgrd.set_plot_options(self.plot_kwargs)
935 difference_bckgrd.set_errorbar_options(self.errorbar_kwargs)
936 difference_bckgrd.set_errorband_options(self.errorband_kwargs)
937 difference_bckgrd.add(data, column, train_mask & bckgrd_mask, test_mask & bckgrd_mask, weight_column)
938 self.axis_d2.set_xlim((difference_bckgrd.xmin, difference_bckgrd.xmax))
939 self.axis_d2.set_ylim((difference_bckgrd.ymin, difference_bckgrd.ymax))
940 difference_bckgrd.plots = difference_bckgrd.labels = []
941 difference_bckgrd.finish(line_color=distribution.plots[1][0][0].get_color())
942
943 try:
944 import scipy.stats
945 # Kolmogorov smirnov test
946 if len(data[column][train_mask & signal_mask]) == 0 or len(data[column][test_mask & signal_mask]) == 0:
947 b2.B2WARNING("Cannot calculate kolmogorov smirnov test for signal due to missing data")
948 else:
949 ks = scipy.stats.ks_2samp(data[column][train_mask & signal_mask], data[column][test_mask & signal_mask])
950 props = dict(boxstyle='round', edgecolor='gray', facecolor='white', linewidth=0.1, alpha=0.5)
951 self.axis_d1.text(0.1, 0.9, r'signal (train - test) difference $p={:.2f}$'.format(ks[1]), fontsize=36, bbox=props,
952 verticalalignment='top', horizontalalignment='left', transform=self.axis_d1.transAxes)
953 if len(data[column][train_mask & bckgrd_mask]) == 0 or len(data[column][test_mask & bckgrd_mask]) == 0:
954 b2.B2WARNING("Cannot calculate kolmogorov smirnov test for background due to missing data")
955 else:
956 ks = scipy.stats.ks_2samp(data[column][train_mask & bckgrd_mask], data[column][test_mask & bckgrd_mask])
957 props = dict(boxstyle='round', edgecolor='gray', facecolor='white', linewidth=0.1, alpha=0.5)
958 self.axis_d2.text(0.1, 0.9, r'background (train - test) difference $p={:.2f}$'.format(ks[1]), fontsize=36,
959 bbox=props,
960 verticalalignment='top', horizontalalignment='left', transform=self.axis_d2.transAxes)
961 except ImportError:
962 b2.B2WARNING("Cannot calculate kolmogorov smirnov test please install scipy!")
963
964 return self
965

◆ finish()

def finish (   self)
Sets limits, title, axis-labels and legend of the plot

Reimplemented from Plotter.

Definition at line 966 of file plotting.py.

966 def finish(self):
967 """
968 Sets limits, title, axis-labels and legend of the plot
969 """
970 self.axis.set_title("Overtraining Plot")
971 self.axis_d1.set_title("")
972 self.axis_d2.set_title("")
973 matplotlib.artist.setp(self.axis.get_xticklabels(), visible=False)
974 matplotlib.artist.setp(self.axis_d1.get_xticklabels(), visible=False)
975 self.axis.get_xaxis().set_label_text('')
976 self.axis_d1.get_xaxis().set_label_text('')
977 self.axis_d2.get_xaxis().set_label_text('Classifier Output')
978 return self
979
980

Member Data Documentation

◆ axis [1/2]

None axis = None
static

Main axis which is used to draw.

Definition at line 859 of file plotting.py.

◆ axis [2/2]

axis

define first subplot

Definition at line 879 of file plotting.py.

◆ axis_d1 [1/2]

None axis_d1 = None
static

Axis which shows the difference between training and test signal.

Definition at line 861 of file plotting.py.

◆ axis_d1 [2/2]

axis_d1

define second subplot

Definition at line 881 of file plotting.py.

◆ axis_d2 [1/2]

None axis_d2 = None
static

Axis which shows the difference between training and test background.

Definition at line 863 of file plotting.py.

◆ axis_d2 [2/2]

axis_d2

define third subplot

Definition at line 883 of file plotting.py.

◆ figure [1/2]

None figure = None
static

figure which is used to draw

Definition at line 857 of file plotting.py.

◆ figure [2/2]

figure

create figure

Definition at line 872 of file plotting.py.


The documentation for this class was generated from the following file: