|
Belle II Software light-2405-quaxo
|
|
Belle II Software light-2405-quaxo
|
Public Member Functions | |
| def | __init__ (self, figure=None, axis=None) |
| def | add_subplot (self, gridspecs) |
| def | save (self, filename) |
| def | set_plot_options (self, plot_kwargs={ 'linestyle':''}) |
| def | set_errorbar_options (self, errorbar_kwargs={ 'fmt':'.', 'elinewidth':3, 'alpha':1}) |
| Overrides default errorbar options for datapoint errorbars. | |
| def | set_errorband_options (self, errorband_kwargs={ 'alpha':0.5}) |
| def | set_fill_options (self, fill_kwargs=None) |
| def | add (self, *args, **kwargs) |
| def | finish (self, *args, **kwargs) |
| def | scale_limits (self) |
Public Attributes | |
| figure | |
| create figure | |
| axis | |
| divide figure into subplots | |
| plots | |
| create empty list for plots | |
| labels | |
| create empty list for labels | |
| xmax | |
| set x limits | |
| ymax | |
| set y limits | |
| yscale | |
| y limit scale | |
| xscale | |
| x limit scale | |
| plot_kwargs | |
| Default keyword arguments for plot function. | |
| errorbar_kwargs | |
| Default keyword arguments for errorbar function. | |
| errorband_kwargs | |
| Default keyword arguments for errorband function. | |
| fill_kwargs | |
| Default keyword arguments for fill_between function. | |
Static Public Attributes | |
| None | plots = None |
| Plots added to the axis so far. | |
| None | labels = None |
| Labels of the plots added so far. | |
| None | xmin = None |
| Minimum x value. | |
| None | xmax = None |
| Maximum x value. | |
| None | ymin = None |
| Minimum y value. | |
| None | ymax = None |
| Maximum y value. | |
| float | yscale = 0.0 |
| limit scale | |
| float | xscale = 0.0 |
| limit scale | |
| None | figure = None |
| figure which is used to draw | |
| None | axis = None |
| Main axis which is used to draw. | |
Protected Member Functions | |
| def | _plot_datapoints (self, axis, x, y, xerr=None, yerr=None) |
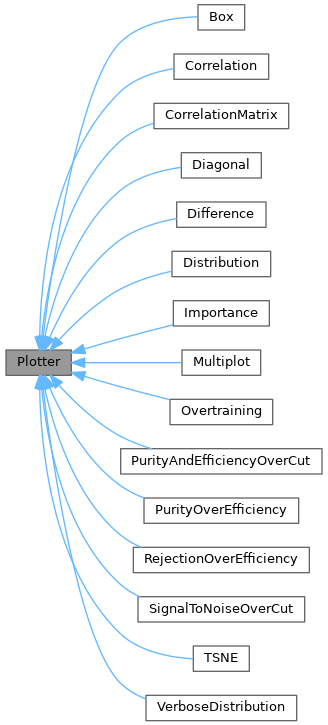
Base class for all Plotters.
Definition at line 43 of file plotting.py.
| def __init__ | ( | self, | |
figure = None, |
|||
axis = None |
|||
| ) |
Creates a new figure and axis if None is given, sets the default plot parameters
@param figure default draw figure which is used
@param axis default draw axis which is used
Reimplemented in Multiplot, Overtraining, Correlation, CorrelationMatrix, Box, VerboseDistribution, Difference, and Distribution.
Definition at line 77 of file plotting.py.
|
protected |
Plot the given datapoints, with plot, errorbar and make a errorband with fill_between
@param x coordinates of the data points
@param y coordinates of the data points
@param xerr symmetric error on x data points
@param yerr symmetric error on y data points
Definition at line 179 of file plotting.py.
| def add | ( | self, | |
| * | args, | ||
| ** | kwargs | ||
| ) |
Add a new plot to this plotter
Reimplemented in Correlation, Box, Distribution, VerboseDistribution, Difference, Diagonal, PurityOverEfficiency, RejectionOverEfficiency, PurityAndEfficiencyOverCut, SignalToNoiseOverCut, Overtraining, TSNE, CorrelationMatrix, Importance, and Multiplot.
Definition at line 247 of file plotting.py.
| def add_subplot | ( | self, | |
| gridspecs | |||
| ) |
Adds a new subplot to the figure, updates all other axes
according to the given gridspec
@param gridspecs gridspecs for all axes including the new one
Definition at line 124 of file plotting.py.
| def finish | ( | self, | |
| * | args, | ||
| ** | kwargs | ||
| ) |
Finish plotting and set labels, legends and stuff
Reimplemented in PurityAndEfficiencyOverCut, SignalToNoiseOverCut, PurityOverEfficiency, RejectionOverEfficiency, Multiplot, Diagonal, Distribution, Box, Overtraining, VerboseDistribution, Correlation, TSNE, Importance, CorrelationMatrix, and Difference.
Definition at line 253 of file plotting.py.
| def save | ( | self, | |
| filename | |||
| ) |
Save the figure into a file
@param filename of the file
Definition at line 136 of file plotting.py.
| def scale_limits | ( | self | ) |
Scale limits to increase distance to boundaries
Definition at line 259 of file plotting.py.
| def set_errorband_options | ( | self, | |
errorband_kwargs = {'alpha': 0.5} |
|||
| ) |
Overrides default errorband options for datapoint errorband
@param errorbar_kwargs keyword arguments for the fill_between function
Definition at line 163 of file plotting.py.
| def set_errorbar_options | ( | self, | |
errorbar_kwargs = {'fmt': '.', 'elinewidth': 3, 'alpha': 1} |
|||
| ) |
Overrides default errorbar options for datapoint errorbars.
Overrides default errorbar options for datapoint errorbars
@param errorbar_kwargs keyword arguments for the errorbar function
Definition at line 155 of file plotting.py.
| def set_fill_options | ( | self, | |
fill_kwargs = None |
|||
| ) |
Overrides default fill_between options for datapoint errorband
@param fill_kwargs keyword arguments for the fill_between function
Definition at line 171 of file plotting.py.
| def set_plot_options | ( | self, | |
plot_kwargs = {'linestyle': ''} |
|||
| ) |
Overrides default plot options for datapoint plot
@param plot_kwargs keyword arguments for the plot function
Definition at line 147 of file plotting.py.
|
static |
Main axis which is used to draw.
Definition at line 75 of file plotting.py.
| axis |
divide figure into subplots
Definition at line 93 of file plotting.py.
| errorband_kwargs |
Default keyword arguments for errorband function.
Definition at line 115 of file plotting.py.
| errorbar_kwargs |
Default keyword arguments for errorbar function.
Definition at line 113 of file plotting.py.
|
static |
figure which is used to draw
Definition at line 73 of file plotting.py.
| figure |
create figure
Definition at line 86 of file plotting.py.
| fill_kwargs |
Default keyword arguments for fill_between function.
Definition at line 117 of file plotting.py.
|
static |
Labels of the plots added so far.
Definition at line 61 of file plotting.py.
| labels |
create empty list for labels
Definition at line 100 of file plotting.py.
| plot_kwargs |
Default keyword arguments for plot function.
Definition at line 111 of file plotting.py.
|
static |
Plots added to the axis so far.
Definition at line 59 of file plotting.py.
| plots |
create empty list for plots
Definition at line 98 of file plotting.py.
|
static |
Maximum x value.
Definition at line 65 of file plotting.py.
| xmax |
set x limits
Definition at line 102 of file plotting.py.
|
static |
Minimum x value.
Definition at line 63 of file plotting.py.
|
static |
limit scale
Definition at line 71 of file plotting.py.
| xscale |
x limit scale
Definition at line 108 of file plotting.py.
|
static |
Maximum y value.
Definition at line 69 of file plotting.py.
| ymax |
set y limits
Definition at line 104 of file plotting.py.
|
static |
Minimum y value.
Definition at line 67 of file plotting.py.
|
static |
limit scale
Definition at line 70 of file plotting.py.
| yscale |
y limit scale
Definition at line 106 of file plotting.py.