Belle II Software light-2405-quaxo
PurityOverEfficiency Class Reference
Inheritance diagram for PurityOverEfficiency:
Collaboration diagram for PurityOverEfficiency:

Public Member Functions

def add (self, data, column, signal_mask, bckgrd_mask, weight_column=None, label=None)
 
def finish (self)
 

Public Attributes

 xmax
 Maximum x value.
 
 ymax
 Maximum y value.
 

Detailed Description

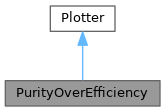
Plots the purity over the efficiency also known as ROC curve

Definition at line 379 of file plotting.py.

Member Function Documentation

◆ add()

def add (   self,
  data,
  column,
  signal_mask,
  bckgrd_mask,
  weight_column = None,
  label = None 
)
Add a new curve to the ROC plot
@param data pandas.DataFrame containing all data
@param column which is used to calculate efficiency and purity for different cuts
@param signal_mask boolean numpy.array defining which events are signal events
@param bckgrd_mask boolean numpy.array defining which events are background events
@param weight_column column in data containing the weights for each event

Reimplemented from Plotter.

Definition at line 388 of file plotting.py.

388 def add(self, data, column, signal_mask, bckgrd_mask, weight_column=None, label=None):
389 """
390 Add a new curve to the ROC plot
391 @param data pandas.DataFrame containing all data
392 @param column which is used to calculate efficiency and purity for different cuts
393 @param signal_mask boolean numpy.array defining which events are signal events
394 @param bckgrd_mask boolean numpy.array defining which events are background events
395 @param weight_column column in data containing the weights for each event
396 """
397 hists = histogram.Histograms(data, column, {'Signal': signal_mask, 'Background': bckgrd_mask}, weight_column=weight_column)
398 efficiency, efficiency_error = hists.get_efficiency(['Signal'])
399 purity, purity_error = hists.get_purity(['Signal'], ['Background'])
400
401 self.xmin, self.xmax = numpy.nanmin([efficiency.min(), self.xmin]), numpy.nanmax([efficiency.max(), self.xmax])
402 self.ymin, self.ymax = numpy.nanmin([numpy.nanmin(purity), self.ymin]), numpy.nanmax([numpy.nanmax(purity), self.ymax])
403
404 p = self._plot_datapoints(self.axis, efficiency, purity, xerr=efficiency_error, yerr=purity_error)
405 self.plots.append(p)
406 if label is not None:
407 self.labels.append(label)
408 else:
409 self.labels.append(column)
410 return self
411

◆ finish()

def finish (   self)
Sets limits, title, axis-labels and legend of the plot

Reimplemented from Plotter.

Definition at line 412 of file plotting.py.

412 def finish(self):
413 """
414 Sets limits, title, axis-labels and legend of the plot
415 """
416 self.axis.set_xlim((self.xmin, self.xmax))
417 self.axis.set_ylim((self.ymin, self.ymax))
418 self.axis.set_title("ROC Purity Plot")
419 self.axis.get_xaxis().set_label_text('Efficiency')
420 self.axis.get_yaxis().set_label_text('Purity')
421 self.axis.legend([x[0] for x in self.plots], self.labels, loc='best', fancybox=True, framealpha=0.5)
422 return self
423
424

Member Data Documentation

◆ xmax

xmax

Maximum x value.

Definition at line 401 of file plotting.py.

◆ ymax

ymax

Maximum y value.

Definition at line 402 of file plotting.py.


The documentation for this class was generated from the following file: