Belle II Software light-2405-quaxo
VerboseDistribution Class Reference
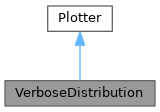
Inheritance diagram for VerboseDistribution:
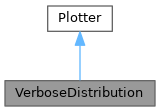
Collaboration diagram for VerboseDistribution:

Public Member Functions

def __init__ (self, figure=None, axis=None, normed=False, range_in_std=None)
 
def add (self, data, column, mask=None, weight_column=None, label=None)
 
def finish (self)
 

Public Attributes

 normed
 Normalize histograms before drawing them.
 
 range_in_std
 Show only a certain range in terms of standard deviations of the data.
 
 box_axes
 create empty list for box axes
 
 distribution
 The distribution plot.
 

Static Public Attributes

None box_axes = None
 Axes for the boxplots.
 

Detailed Description

Plots distribution of a quantity including boxplots

Definition at line 981 of file plotting.py.

Constructor & Destructor Documentation

◆ __init__()

def __init__ (   self,
  figure = None,
  axis = None,
  normed = False,
  range_in_std = None 
)
Creates a new figure and axis if None is given, sets the default plot parameters
@param figure default draw figure which is used
@param axis default draw axis which is used
@param normed true if the histograms should be normed before drawing
@param range_in_std show only the data in a windows around +- range_in_std * standard_deviation around the mean

Reimplemented from Plotter.

Definition at line 989 of file plotting.py.

989 def __init__(self, figure=None, axis=None, normed=False, range_in_std=None):
990 """
991 Creates a new figure and axis if None is given, sets the default plot parameters
992 @param figure default draw figure which is used
993 @param axis default draw axis which is used
994 @param normed true if the histograms should be normed before drawing
995 @param range_in_std show only the data in a windows around +- range_in_std * standard_deviation around the mean
996 """
997 super().__init__(figure, axis)
998
999 self.normed = normed
1000
1001 self.range_in_std = range_in_std
1002
1003 self.box_axes = []
1004
1005 self.distribution = Distribution(self.figure, self.axis, normed_to_all_entries=self.normed, range_in_std=self.range_in_std)
1006

Member Function Documentation

◆ add()

def add (   self,
  data,
  column,
  mask = None,
  weight_column = None,
  label = None 
)
Add a new distribution plot, with additional information like a boxplot compared to
the ordinary Distribution plot.
@param data pandas.DataFrame containing all data
@param column which is used to calculate distribution histogram
@param mask boolean numpy.array defining which events are used for the distribution histogram
@param weight_column column in data containing the weights for each event

Reimplemented from Plotter.

Definition at line 1007 of file plotting.py.

1007 def add(self, data, column, mask=None, weight_column=None, label=None):
1008 """
1009 Add a new distribution plot, with additional information like a boxplot compared to
1010 the ordinary Distribution plot.
1011 @param data pandas.DataFrame containing all data
1012 @param column which is used to calculate distribution histogram
1013 @param mask boolean numpy.array defining which events are used for the distribution histogram
1014 @param weight_column column in data containing the weights for each event
1015 """
1016 self.distribution.set_plot_options(self.plot_kwargs)
1017 self.distribution.set_errorbar_options(self.errorbar_kwargs)
1018 self.distribution.set_errorband_options(self.errorband_kwargs)
1019 self.distribution.add(data, column, mask, weight_column, label=label)
1020
1021 n = len(self.box_axes) + 1
1022 gs = matplotlib.gridspec.GridSpec(4 * n, 1)
1023 gridspecs = [gs[:3 * n, :]] + [gs[3 * n + i, :] for i in range(n)]
1024 box_axis = self.add_subplot(gridspecs)
1025
1026 if self.range_in_std is not None:
1027 mean, std = histogram.weighted_mean_and_std(data[column], None if weight_column is None else data[weight_column])
1028 # Everything outside mean +- range_in_std * std is considered not inside the mask
1029 mask = mask & (data[column] > (mean - self.range_in_std * std)) & (data[column] < (mean + self.range_in_std * std))
1030 box = Box(self.figure, box_axis)
1031 box.add(data, column, mask, weight_column)
1032 if len(box.plots) > 0:
1033 box.plots[0]['boxes'][0].set_facecolor(self.distribution.plots[-1][0][0].get_color())
1034 box.finish()
1035
1036 self.box_axes.append(box_axis)
1037 return self
1038
def weighted_mean_and_std(x, w)
Definition: histogram.py:31

◆ finish()

def finish (   self)
Sets limits, title, axis-labels and legend of the plot

Reimplemented from Plotter.

Definition at line 1039 of file plotting.py.

1039 def finish(self):
1040 """
1041 Sets limits, title, axis-labels and legend of the plot
1042 """
1043 self.distribution.finish()
1044 matplotlib.artist.setp(self.axis.get_xticklabels(), visible=False)
1045 self.axis.get_xaxis().set_label_text('')
1046 for box_axis in self.box_axes[:-1]:
1047 matplotlib.artist.setp(box_axis.get_xticklabels(), visible=False)
1048 box_axis.set_title("")
1049 box_axis.get_xaxis().set_label_text('')
1050 self.box_axes[-1].set_title("")
1051 self.axis.set_title("Distribution Plot")
1052 self.axis.legend([x[0] for x in self.distribution.plots], self.distribution.labels,
1053 loc='best', fancybox=True, framealpha=0.5)
1054 return self
1055
1056

Member Data Documentation

◆ box_axes [1/2]

None box_axes = None
static

Axes for the boxplots.

Definition at line 987 of file plotting.py.

◆ box_axes [2/2]

box_axes

create empty list for box axes

Definition at line 1003 of file plotting.py.

◆ distribution

distribution

The distribution plot.

Definition at line 1005 of file plotting.py.

◆ normed

normed

Normalize histograms before drawing them.

Definition at line 999 of file plotting.py.

◆ range_in_std

range_in_std

Show only a certain range in terms of standard deviations of the data.

Definition at line 1001 of file plotting.py.


The documentation for this class was generated from the following file: