 |
Belle II Software
release-08-01-10
|
 |
Belle II Software
release-08-01-10
|
Event display designed to run with Genfit. More...
#include <EventDisplay.h>


Public Member Functions | |
| void | reset () |
| Drop all events. | |
| void | addEvent (std::vector< genfit::Track * > &tracks) |
| Add new event. More... | |
| void | addEvent (std::vector< const genfit::Track * > &tracks) |
| void | addEvent (const Track *tr) |
| Add new event. More... | |
| void | next (unsigned int stp=1) |
| Go to the next event or step a certain number of events ahead. | |
| void | prev (unsigned int stp=1) |
| Go to the previous event or step a certain number of events back. | |
| void | gotoEvent (unsigned int id) |
| Go to event with index id. | |
| int | getNEvents () |
| Get the total number of events stored. | |
| void | setOptions (std::string opts) |
| Set the display options. More... | |
| void | setErrScale (double errScale=1.) |
| Set the scaling factor for the visualization of the errors. | |
| double | getErrScale () |
| Get the error scaling factor. | |
| void | open () |
| Open the event display. | |
| void | guiGoto () |
| void | guiGoto2 () |
| void | guiSetDrawParams () |
| void | guiSelectFitterId (int val) |
| void | guiSelectMmHandling (int val) |
Static Public Member Functions | |
| static EventDisplay * | getInstance () |
Private Member Functions | |
| void | makeGui () |
| Build the buttons for event navigation. | |
| void | drawEvent (unsigned int id, bool resetCam=true) |
| Draw an event. | |
| TEveBox * | boxCreator (TVector3 o, TVector3 u, TVector3 v, float ud, float vd, float depth) |
| Create a box around o, oriented along u and v with widths ud, vd and depth and return a pointer to the box object. | |
| void | makeLines (const StateOnPlane *prevState, const StateOnPlane *state, const AbsTrackRep *rep, const Color_t &color, const Style_t &style, bool drawMarkers, bool drawErrors, double lineWidth=2, int markerPos=1) |
Private Attributes | |
| unsigned int | eventId_ |
| double | errorScale_ |
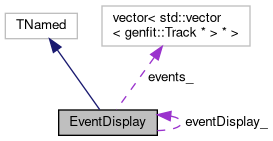
| std::vector< std::vector< genfit::Track * > * > | events_ |
| TGNumberEntry * | guiEvent |
| TGNumberEntry * | guiEvent2 |
| TGCheckButton * | guiDrawGeometry_ |
| bool | drawGeometry_ |
| TGCheckButton * | guiDrawDetectors_ |
| bool | drawDetectors_ |
| TGCheckButton * | guiDrawHits_ |
| bool | drawHits_ |
| TGCheckButton * | guiDrawErrors_ |
| bool | drawErrors_ |
| TGCheckButton * | guiDrawPlanes_ |
| bool | drawPlanes_ |
| TGCheckButton * | guiDrawTrackMarkers_ |
| bool | drawTrackMarkers_ |
| TGCheckButton * | guiDrawTrack_ |
| bool | drawTrack_ |
| TGCheckButton * | guiDrawRefTrack_ |
| bool | drawRefTrack_ |
| TGCheckButton * | guiDrawForward_ |
| bool | drawForward_ |
| TGCheckButton * | guiDrawBackward_ |
| bool | drawBackward_ |
| TGCheckButton * | guiDrawAutoScale_ |
| bool | drawAutoScale_ |
| TGCheckButton * | guiDrawScaleMan_ |
| bool | drawScaleMan_ |
| TGNumberEntry * | guiErrorScale_ |
| bool | drawSilent_ |
| TGCheckButton * | guiDrawCardinalRep_ |
| bool | drawCardinalRep_ |
| TGNumberEntry * | guiRepId_ |
| unsigned int | repId_ |
| TGCheckButton * | guiDrawAllTracks_ |
| bool | drawAllTracks_ |
| TGNumberEntry * | guiTrackId_ |
| unsigned int | trackId_ |
| TGCheckButton * | guiRefit_ |
| bool | refit_ |
| TGNumberEntry * | guiDebugLvl_ |
| unsigned int | debugLvl_ |
| TGButtonGroup * | guiFitterId_ |
| eFitterType | fitterId_ |
| TGButtonGroup * | guiMmHandling_ |
| eMultipleMeasurementHandling | mmHandling_ |
| TGCheckButton * | guiSquareRootFormalism_ |
| bool | squareRootFormalism_ |
| TGNumberEntry * | guiDPVal_ |
| double | dPVal_ |
| TGNumberEntry * | guiRelChi2_ |
| double | dRelChi2_ |
| TGNumberEntry * | guiDChi2Ref_ |
| double | dChi2Ref_ |
| TGNumberEntry * | guiNMinIter_ |
| unsigned int | nMinIter_ |
| TGNumberEntry * | guiNMaxIter_ |
| unsigned int | nMaxIter_ |
| TGNumberEntry * | guiNMaxFailed_ |
| int | nMaxFailed_ |
| TGCheckButton * | guiResort_ |
| bool | resort_ |
Static Private Attributes | |
| static EventDisplay * | eventDisplay_ = nullptr |
Event display designed to run with Genfit.
The EventDisplay class is a singelton used to visualize the events processed with Genfit. The event display uses the EVE event visualization package to visualize Tracks which are bundled in a vector and which form one event. The information about the tracks is supplied in Track objects. To use the event display, the geometry (TGeoManager)and magnetic field (FieldManager) have to be initialized and gApplication and gEve have to exist.
Definition at line 59 of file EventDisplay.h.
| void addEvent | ( | const Track * | tr | ) |
Add new event.
Add a new event consisting of one track.
Definition at line 188 of file EventDisplay.cc.
| void addEvent | ( | std::vector< genfit::Track * > & | tracks | ) |
Add new event.
Add a new event. An event is a collection of Tracks which are displayed at the the same time. The tracks are copied.
Definition at line 164 of file EventDisplay.cc.
| void setOptions | ( | std::string | opts | ) |
Set the display options.
The option string lets you steer the way the events are displayed. The following options are available:
'A': Autoscale errors. The representation of hits are scaled with the error found their covariance matrix. This can lead to hits not being displayed beause the errors are too small. Autoscaling ensures that the errors are scaled up sufficiently to ensure all hits are displayed. However, this can lead to unwanted results if there are only a few hits with very small errors, as all hits are scaled by the same factor to ensure consistency.
'B': Draw Backward Fit (track segments start at updates and end at predictions)
'D': Draw detectors. This causes a simple representation for all detectors to be drawn. For planar detectors, this is a plane with the same position and orientation of the real detector plane, but with different size. For wires, this is a tube whose diameter is equal to the value measured by the wire. Spacepoint hits are not affected by this option.
'E': Draw Error cones (position and direction uncertainties) around the track.
'F': Draw Forward Fit (track segments start at updates and end at predictions) 'H': Draw hits. This causes the hits to be visualized. Normally, the size of the hit representation is connected to the covariance matrix of the hit, scaled by the value set in setErrScale which is normally 1. See also option 'A' and 'S'. Normally used in connection with 'D'.
'G': Draw geometry. Draw also the geometry in the gGeoManager. This feature is experimental and may lead to strang things being drawn.
'M': Draw track markers. Draw the intersection points between the track and the virtual (and/or real) detector planes. Can only be used in connection with 'T'.
'P': Draw detector planes. Draws the virtual (and/or real) detector planes.
'S': Scale manually. This leads to the spacepoint hits (and only them up to now!) being drawn as spheres with radius 0.5 scaled with the error scale factor. Can be used if the scaling with errors leads to problems.
'T': Draw Track. Draw the track as lines between the virtual (and/or real) detector planes.
'X': Draw silent. Does not run the TApplication.
Definition at line 112 of file EventDisplay.cc.